Local Observability with Prometheus & Grafana
🎯 Objective
Welcome! This hands-on project is designed to introduce new Site Reliability Engineers (SREs) to our foundational observability stack. You’ll simulate the process of deploying and working with the same tools and configurations we use across our environments.
By the end of this exercise, you will:
-
Deploy a local Prometheus + Grafana observability stack using our standardized Skaffold + Kustomize setup.
-
Confirm that Prometheus is successfully scraping metrics from local services.
-
Build a Grafana dashboard visualizing Service Level Indicators (SLIs) like latency, throughput, and error rates.
-
Understand how our observability tooling helps us troubleshoot issues in real time and support long-term system reliability.
This simulation mirrors our production workflows for issue investigation, deployment validation, and SLO monitoring.
🧰 Stack Overview
| Tool | Purpose |
|---|---|
Skaffold |
automates deployment and developer workflow |
Kustomize |
manages Kubernetes overlays across environments |
Kubernetes |
running locally via Docker Desktop |
Prometheus |
collects and scrapes metrics |
Grafana |
visualizes time-series metrics |
Sample App |
exposes metrics endpoint (e.g. /actuator/prometheus) |
📁 Deployment: Grafana Configuration
-
Create a new file called
grafana-deployment.yamlwith the following content:grafana-deployment.yaml
apiVersion: apps/v1 kind: Deployment metadata: name: grafana labels: service: grafana spec: replicas: 1 selector: matchLabels: service: grafana strategy: type: Recreate template: metadata: labels: service: grafana spec: containers: - name: grafana image: grafana/grafana env: - name: GF_AUTH_ANONYMOUS_ENABLED value: "true" - name: GF_AUTH_ANONYMOUS_ORG_ROLE value: Admin - name: GF_AUTH_DISABLE_LOGIN_FORM value: "true" - name: GF_FEATURE_TOGGLES_ENABLE value: tempoSearch,tempoServiceGraph,tempoApmTable - name: GF_USERS_DEFAULT_THEME value: dark ports: - containerPort: 3000 hostPort: 3000 protocol: TCP resources: {} volumeMounts: - name: grafana-cm0 mountPath: /etc/grafana/grafana.ini subPath: grafana.ini - name: grafana-cm1 mountPath: /etc/grafana/provisioning/datasources/datasources.yaml subPath: datasources.yaml restartPolicy: Always volumes: - name: grafana-cm0 configMap: name: grafana-cm0 items: - key: grafana.ini path: grafana.ini - name: grafana-cm1 configMap: name: grafana-cm1 items: - key: grafana-datasources.yaml path: datasources.yaml --- apiVersion: v1 kind: Service metadata: name: grafana labels: service: grafana spec: selector: service: grafana type: NodePort ports: - port: 3000 targetPort: 3000 name: "3000" -
Create the following ConfigMaps to support Grafana configuration:
grafana-cm0(INI config)Grafana ConfigMaps
--- apiVersion: v1 kind: ConfigMap metadata: name: grafana-cm0 labels: service: grafana annotations: use-subpath: "true" data: grafana.ini: |- [feature_toggles] enable = traceToMetrics tempoApmTable tempoSearch tempoBackendSearch tempoServiceGraphgrafana-cm1(Datasources)--- apiVersion: v1 kind: ConfigMap metadata: name: grafana-cm1 labels: service: grafana annotations: use-subpath: "true" data: grafana-datasources.yaml: |- apiVersion: 1 datasources: - name: Prometheus type: prometheus access: proxy orgId: 1 url: http://prometheus:9090 basicAuth: false isDefault: true editable: true version: 1 uid: prometheus jsonData: httpMethod: POST exemplarTraceIdDestinations: - datasourceUid: tempo name: trace_id - name: TempoPrometheus type: prometheus access: proxy orgId: 1 url: http://prometheus:9090 basicAuth: false isDefault: false editable: true version: 1 uid: tempo-prometheus jsonData: httpMethod: POST exemplarTraceIdDestinations: - datasourceUid: tempo name: traceID - name: Tempo type: tempo access: proxy orgId: 1 url: http://tempo:3200 basicAuth: false isDefault: false editable: true version: 1 apiVersion: 1 uid: tempo jsonData: httpMethod: GET tracesToMetrics: datasourceUid: 'prometheus' tags: [{ key: 'service.name', value: 'service' }, { key: 'job' }] queries: - name: 'Sample query' query: 'sum(rate(tempo_spanmetrics_latency_bucket{$__tags}[5m]))' serviceMap: datasourceUid: 'prometheus' search: hide: false nodeGraph: enabled: true
📁 Deployment: Prometheus Configuration
-
Create a new file called
prometheus-deployment.yamland include the following:prometheus-deployment.yaml
apiVersion: apps/v1 kind: Deployment metadata: name: prometheus labels: service: prometheus spec: replicas: 1 selector: matchLabels: service: prometheus strategy: type: Recreate template: metadata: labels: service: prometheus spec: serviceAccountName: prometheus containers: - name: prometheus image: prom/prometheus:latest command: ["/bin/sh", "-c"] args: - > prometheus ${PROMETHEUS_CONFIG} ${PROMETHEUS_FEATURE} ${PROMETHEUS_STORAGE} ${PROMETHEUS_LIBRARIES} ${PROMETHEUS_TEMPLATES} ${PROMETHEUS_REMOTE_WRITE} ${PROMETHEUS_LIFECYCLE} env: - name: PROMETHEUS_CONFIG value: "--config.file=/etc/prometheus.yaml" - name: PROMETHEUS_FEATURE value: "--enable-feature=exemplar-storage" - name: PROMETHEUS_STORAGE value: "--storage.tsdb.path=/prometheus" - name: PROMETHEUS_LIBRARIES value: "--web.console.libraries=/usr/share/prometheus/console_libraries" - name: PROMETHEUS_TEMPLATES value: "--web.console.templates=/usr/share/prometheus/consoles" - name: PROMETHEUS_REMOTE_WRITE value: "--web.enable-remote-write-receiver" - name: PROMETHEUS_LIFECYCLE value: "--web.enable-lifecycle" ports: - containerPort: 9090 hostPort: 9090 protocol: TCP volumeMounts: - name: prometheus-cm0 mountPath: /etc/prometheus.yaml subPath: prometheus.yaml - name: prometheus-alert-rules-config mountPath: /etc/prometheus/alert-rules.yml subPath: alert-rules.yml restartPolicy: Always volumes: - name: prometheus-cm0 configMap: name: prometheus-cm0 - name: prometheus-alert-rules-config configMap: name: prometheus-alert-rules-config --- apiVersion: v1 kind: Service metadata: name: prometheus labels: service: prometheus spec: selector: service: prometheus type: NodePort ports: - port: 9090 targetPort: 9090 name: "9090" -
Create the following ConfigMaps for Prometheus:
Prometheus ConfigMaps
Service Account + RBAC
---
apiVersion: v1
kind: ServiceAccount
metadata:
  name: prometheus

---
apiVersion: rbac.authorization.k8s.io/v1
kind: ClusterRole
metadata:
  name: discoverer
rules:
  - apiGroups: [""]
    resources: ["nodes", "services", "endpoints", "pods"]
    verbs: ["get", "list", "watch"]
  - apiGroups: ["extensions"]
    resources: ["ingresses"]
    verbs: ["get", "list", "watch"]

---
apiVersion: rbac.authorization.k8s.io/v1
kind: ClusterRoleBinding
metadata:
  name: prometheus-discoverer
roleRef:
  apiGroup: rbac.authorization.k8s.io
  kind: ClusterRole
  name: discoverer
subjects:
  - kind: ServiceAccount
    name: prometheus
    namespace: starter-service-test
Prometheus Alert Rules ConfigMap + Node Exporter
---
apiVersion: v1
kind: ConfigMap
metadata:
  name: prometheus-alert-rules-config
  annotations:
    use-subpath: "true"
  labels:
    service: prometheus
data:
  alert-rules.yml: |
    groups:
      - name: alert.rules
        rules:
          - alert: KubeProxyDown
            expr: absent(container_memory_usage_bytes{container=~"kube-proxy-*"})
            for: 30s
            labels:
              severity: critical
            annotations:
              identifier: "{{ $labels.container }}"
              summary: "{{ $labels.container }} has been down for 30 seconds. Check pod {{ $labels.pod }}.{{ $labels.namespace }}"
              title: "KubeProxyDown"
              list: "yes"
          - alert: KubeControllerDown
            expr: absent(container_memory_usage_bytes{container=~"kube-controller-manager-*"})
            for: 30s
            labels:
              severity: critical
            annotations:
              identifier: "kube-controller-manager"
              summary: "kube-controller-manager on node has been down for 30 seconds. Exec into node and run 'service kubelet status'"
              title: "KubeControllerDown"
              list: "yes"
          - alert: KubeAPIServerDown
            expr: absent(container_memory_usage_bytes{container=~"kube-apiserver-*"})
            for: 30s
            labels:
              severity: critical
            annotations:
              identifier: "kube-apiserver-*"
              summary: "kube-apiserver on node has been down for 30 seconds. Exec into node and run 'service kubelet status'"
              title: "KubeAPIServerDown"
              list: "yes"
          - alert: KubeSchedulerDown
            expr: absent(container_memory_usage_bytes{container=~"kube-scheduler-*"})
            for: 30s
            labels:
              severity: critical
            annotations:
              identifier: "kube-scheduler-*"
              summary: "kube-scheduler on node has been down for 30 seconds. Exec into node and run 'service kubelet status'"
              title: "KubeSchedulerDown"
              list: "yes"
          - alert: CoreDNSDown
            expr: absent(container_memory_usage_bytes{container=~"coredns"})
            for: 30s
            labels:
              severity: critical
            annotations:
              identifier: "{{ $labels.container }}"
              summary: "{{ $labels.container }} has been down for 30 seconds. Check pod {{ $labels.pod }}.{{ $labels.namespace }}"
              title: "CoreDNSPodDown"
              list: "yes"
          - alert: ETCDDown
            expr: absent(container_memory_usage_bytes{container=~"etcd"})
            for: 30s
            labels:
              severity: critical
            annotations:
              identifier: "{{ $labels.container }}"
              summary: "{{ $labels.container }} has been down for 30 seconds. Check pod {{ $labels.pod }}.{{ $labels.namespace }}"
              title: "ETCDPodDown"
              list: "yes"


---
apiVersion: v1
kind: ConfigMap
metadata:
  name: prometheus-cm0
  annotations:
    use-subpath: "true"
  labels:
    service: prometheus
data:
  prometheus.yaml: |
    global:
      scrape_interval: 10s
      external_labels:
        monitor: hello-observability

    scrape_configs:
      - job_name: prometheus
        scrape_interval: 10s
        static_configs:
          - targets: [prometheus:9090]
      - job_name: kubernetes-service-endpoints
        kubernetes_sd_configs:
          - role: endpoints
        relabel_configs:
          - action: keep
            regex: true
            source_labels:
              - __meta_kubernetes_service_annotation_prometheus_io_scrape
          - action: replace
            regex: (https?)
            source_labels:
              - __meta_kubernetes_service_annotation_prometheus_io_scheme
            target_label: __scheme__
          - action: replace
            regex: (.+)
            source_labels:
              - __meta_kubernetes_service_annotation_prometheus_io_path
            target_label: __metrics_path__
          - action: replace
            regex: ([^:]+)(?::\d+)?;(\d+)
            replacement: $1:$2
            source_labels:
              - __address__
              - __meta_kubernetes_service_annotation_prometheus_io_port
            target_label: __address__
          - action: labelmap
            regex: __meta_kubernetes_service_label_(.+)
          - action: replace
            source_labels:
              - __meta_kubernetes_namespace
            target_label: kubernetes_namespace
          - action: replace
            source_labels:
              - __meta_kubernetes_service_name
            target_label: kubernetes_name
          - action: replace
            source_labels:
              - __meta_kubernetes_pod_node_name
            target_label: kubernetes_node
      - job_name: kubernetes-pods
        kubernetes_sd_configs:
          - role: pod
        relabel_configs:
          - action: keep
            regex: true
            source_labels:
              - __meta_kubernetes_pod_annotation_prometheus_io_scrape
          - action: replace
            regex: (.+)
            source_labels:
              - __meta_kubernetes_pod_annotation_prometheus_io_path
            target_label: __metrics_path__
          - action: replace
            regex: ([^:]+)(?::\d+)?;(\d+)
            replacement: $1:$2
            source_labels:
              - __address__
              - __meta_kubernetes_pod_annotation_prometheus_io_port
            target_label: __address__
          - action: labelmap
            regex: __meta_kubernetes_pod_label_(.+)
          - action: replace
            source_labels:
              - __meta_kubernetes_namespace
            target_label: kubernetes_namespace
          - action: replace
            source_labels:
              - __meta_kubernetes_pod_name
            target_label: kubernetes_pod_name
          - action: drop
            regex: Pending|Succeeded|Failed
            source_labels:
              - __meta_kubernetes_pod_phase

    rule_files:
      - /etc/prometheus/alert-rules.yml

    alerting:
      alertmanagers:
        - kubernetes_sd_configs:
            - role: service
          relabel_configs:
            - source_labels: [ __meta_kubernetes_service_name ]
              regex: alertmanager
              action: keep
            - source_labels: [ __meta_kubernetes_namespace ]
              regex: monitoring
              action: keep


---
apiVersion: apps/v1
kind: DaemonSet
metadata:
  name: node-exporter
spec:
  selector:
    matchLabels:
      app: node-exporter
  template:
    metadata:
      labels:
        app: node-exporter
    spec:
      containers:
        - name: node-exporter
          image: prom/node-exporter:latest
          ports:
            - containerPort: 9100
              hostPort: 9100
          volumeMounts:
            - name: proc
              mountPath: /host/proc
              readOnly: true
            - name: sys
              mountPath: /host/sys
              readOnly: true
            - name: root
              mountPath: /rootfs
              readOnly: true
      volumes:
        - name: proc
          hostPath:
            path: /proc
        - name: sys
          hostPath:
            path: /sys
        - name: root
          hostPath:
            path: /

---
apiVersion: v1
kind: Service
metadata:
  name: node-exporter
spec:
  selector:
    app: node-exporter
  ports:
    - name: metrics
      port: 9100
      targetPort: 9100
  clusterIP: None
Deployment and Testing
🛠 Update Kustomization YAML File
Go to kubernetes/base/kustomization.yaml and add in the following entries under the resources block:
- grafana-deployment.yaml
- prometheus-deployment.yaml
🚢 Proceed with Skaffold Deployment
With your local kustomization.yaml updated, you’re now ready to launch the stack.
Run the following command to deploy Prometheus, Grafana, and the target application using Skaffold:
skaffold devAt this point you should ensure you have exposed port 9090 for Prometheus and port 3000 for Grafana using either the kubectl port-forward, or k9s or via headlamp console.
The applications (kubectl, k9s and headlamp) are referenced here K8s Monitoring Tools
|
🔍 Testing Prometheus Query and Correcting Errors Present
Prometheus URL: http://localhost:9090
Before we build out the Grafana dashboard, let’s start by testing a few of the Prometheus queries that will power the panels.
Head over to http://localhost:9090, switch to the "Graph" tab, and run the following example queries to preview the metrics:
up
irate(http_server_requests_seconds_count[1m])
irate(system_cpu_usage[1m])
irate(jvm_gc_memory_allocated_bytes_total[1m])
process_cpu_usage
system_cpu_usage
📊 Create a Grafana Dashboard
Grafana URL: http://localhost:3000
Now that Prometheus and Grafana are running, it’s time to create your first SRE dashboard. This will give you visibility into key service-level indicators (SLIs) for performance and system health.
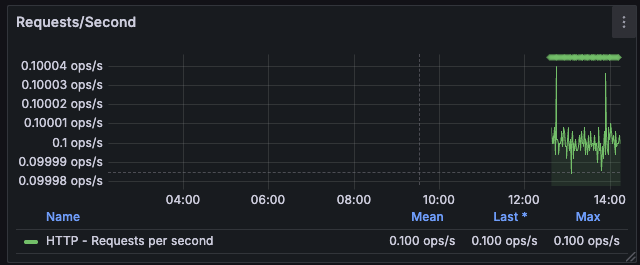
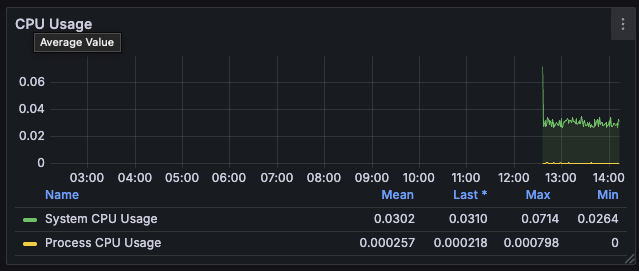
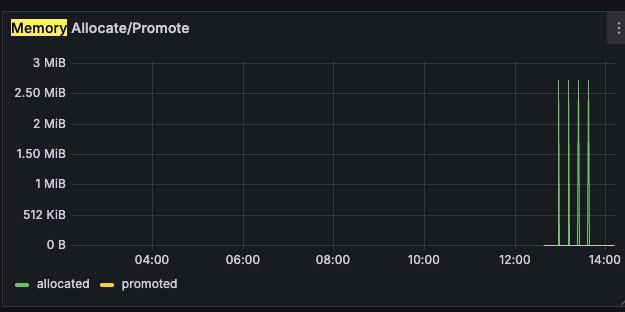
🎯 Your goal: Build a dashboard with visualizations for HTTP Codes, HTTP Requests/Second, CPU usage, and memory usage.
-
Go to Dashboards → New → New Dashboard → Prometheus [default] and create these 4 panels with the names below:
-
Panel 1: HTTP Codes Rate
-
Panel 2: HTTP Requests/Second (by URI)
-
Panel 3: CPU usage (%)
-
Panel 4: Memory Usage (%)
-
🟦 HTTP Codes Rate
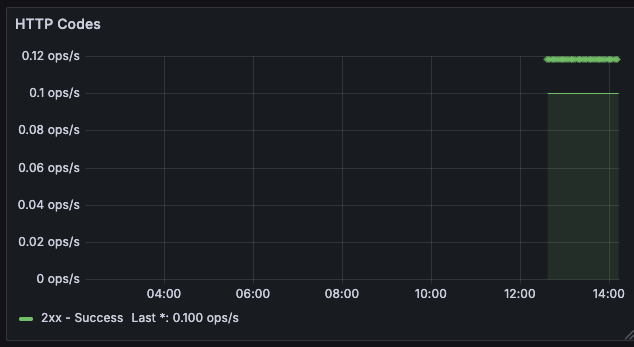
sum(rate(http_server_requests_seconds_count{app="$application", status=~"2..", uri!~".*system.*", uri!~"root"}[1m]))